

Key Takeaways
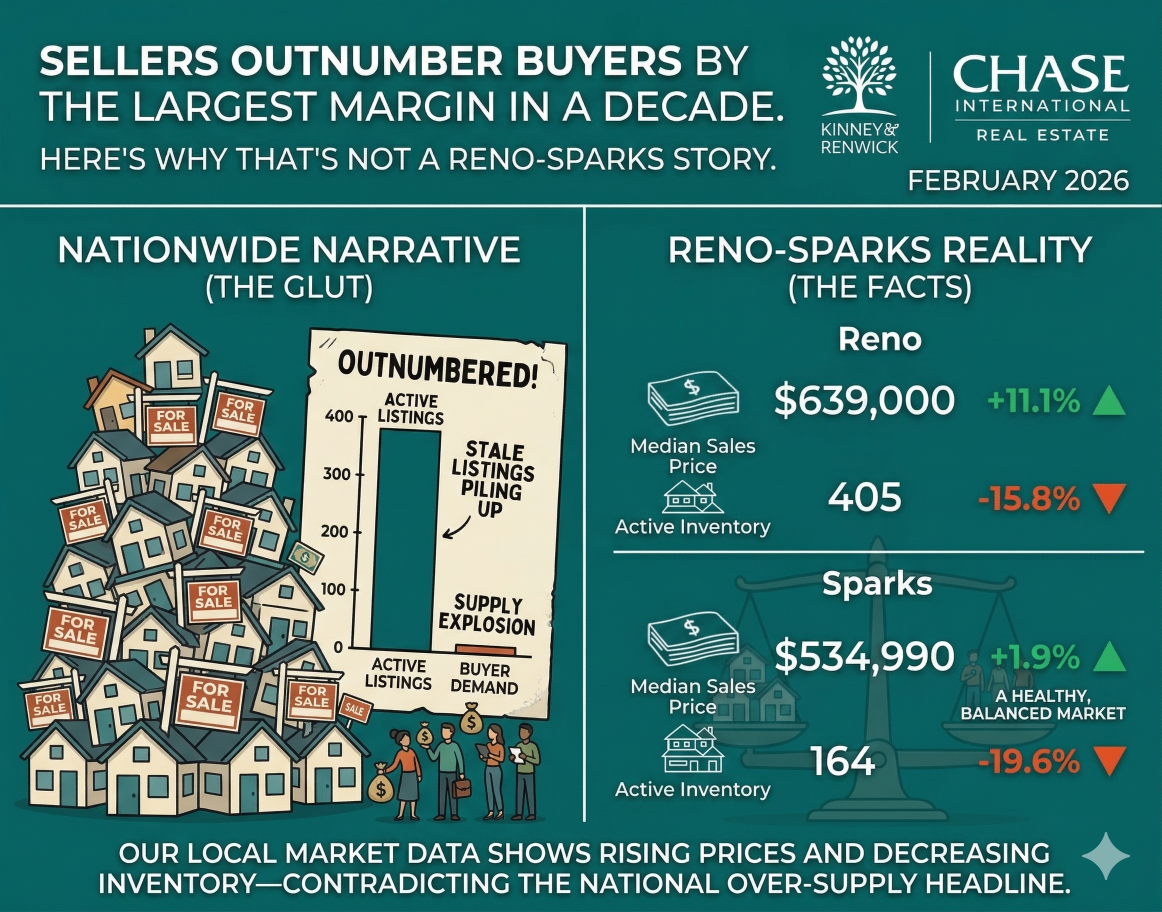
- Nationally, sellers outnumber buyers by 46.3% — the largest gap since Redfin began tracking this data in 2013. The imbalance is concentrated in the Sun Belt, particularly Texas and Florida. The Northeast remains firmly in sellers market territory.
- Reno-Sparks is not a Sun Belt market. Sparks had 1.6 months of supply in February, Reno had 2.1 months — both well below the 4- to 6-month threshold that defines a balanced market. Sellers received 98.6% to 99.1% of list price.
- Housing affordability improved in all 50 states over the past year, according to First American research, meaning more buyers can qualify for a Reno-Sparks home today than at any point since early 2022.
- The nationally identified peak listing window runs April 12–18, per Realtor.com — homes listed that week historically sell for approximately 1.3% more, generate 16.7% more buyer views, and see 18.9% fewer price reductions.
- Mortgage rates sit at 6.22% as of March 19 (Freddie Mac PMMS) — still nearly half a percentage point lower than this time last year, preserving real purchasing power improvements for your buyer pool.
Data current as of March 23, 2026. Local market statistics sourced from the Northern Nevada Regional MLS (NNRMLS) via Domus Analytics, most recent complete data available February 2026. Mortgage rate data from the Freddie Mac Primary Mortgage Market Survey (PMMS), released March 19, 2026. National market timing data from Realtor.com and Zillow (March 2026). Buyers-vs-sellers analysis from Redfin (February 2026). Affordability data from First American via Keeping Current Matters (March 2026). All figures are informational only and do not constitute financial, legal, or investment advice. Kevin Kinney and Robin Renwick are licensed Nevada real estate professionals.
This morning a headline moved through every real estate industry feed in the country: sellers outnumber buyers by the largest margin since 2013. According to Redfin's February 2026 analysis, there were 46.3% more sellers than buyers in the U.S. housing market — the single largest gap since Redfin began tracking this data thirteen years ago. In raw numbers, that's nearly 630,000 more sellers than buyers in a single month. If you own a home in Reno or Sparks and you've been thinking about listing this spring, that number probably gave you pause.
That's a reasonable reaction to a genuinely significant statistic. But before you rethink your timeline or talk yourself out of a spring listing, it's worth asking the question that national headlines almost never bother to answer: where, exactly, is that story happening?
The Sun Belt Trap
Every national real estate statistic has a geography inside it. The Redfin report is explicit about where the imbalance is most pronounced: the South holds the strongest buyers markets, particularly Texas and Florida. The Northeast, by contrast, has the strongest sellers markets in the country. That geographic texture isn't buried in footnotes — it's the core finding.
Texas and Florida have experienced dramatic construction booms over the past three years. Builders poured inventory into Dallas, Austin, Jacksonville, Tampa, and Cape Coral at a pace that has produced genuine oversupply in many of those markets, compounded by rising insurance costs and shifts in migration patterns that accelerated and then partially reversed through the pandemic years. Some Florida metros now carry months of supply approaching double digits. Certain Texas markets have returned to the kind of buyer leverage last seen in 2018 or 2019. That is a real and consequential story for homeowners in those markets.
It is not a Reno-Sparks story.
There's a thinking error we see every time a concerning national statistic hits the news cycle. Homeowners read the headline, register the weight of the number, and apply it to their specific property on their specific street — without pausing to ask whether the underlying data describes their market at all. We call this the Sun Belt Trap: importing a narrative about Florida and Texas inventory conditions as though it explains what's happening on your cul-de-sac in Somersett or your street in Spanish Springs. It doesn't. National real estate statistics are weighted averages of hundreds of metro markets, and the shape of those averages — which markets are driving the numbers, and in which direction — matters as much as the headline figure itself.
Nevada is not Texas. Reno is not Jacksonville. The economic forces drawing buyers to this market, the structural constraints on housing supply, and the character of the demand are categorically different from the Sun Belt markets that dominate the national buyers-market story this spring.
What the Reno-Sparks Data Actually Shows
Reno-Sparks operates on a fundamentally different supply structure than the markets driving the national narrative. The February 2026 data from the Northern Nevada Regional MLS — the most recent complete data available — shows Reno at 2.1 months of supply and Sparks at just 1.6 months. A balanced market, where neither buyers nor sellers hold structural advantage, requires between four and six months of supply. The national average has been climbing toward that range in recent months, partly because of the Sun Belt inventory surge. The Reno-Sparks market is less than halfway to balance. The February 2026 Reno-Sparks Housing Market Update covers every relevant metric in detail — supply, pricing, contract velocity, and the economic context behind the numbers.
The supply picture translates directly into what sellers are experiencing at the negotiating table. In February 2026, sellers in Reno received an average of 98.6% of their asking price. Sellers in Sparks received 99.1%. In Sparks, the median days to contract hit 17 days — a pace that reflects a market where prepared, well-priced homes are not sitting. The combined active inventory across both cities was approximately 569 homes for an entire metropolitan area. These are not the numbers of a market where sellers are losing leverage. They are the numbers of a market where serious, motivated buyers are still competing.
For context on what 569 active homes means at a human scale: Reno has a population of roughly 270,000 people. Sparks has another 110,000. The entire active inventory for a metro of nearly 400,000 people fits comfortably in a high school gymnasium. The Sun Belt buyers market story is, in large part, a story about inventory. Reno-Sparks simply does not have the same inventory picture.
It's worth acknowledging that conditions can and do shift. The February data is the most current verified snapshot available, and March data won't be released for several weeks. What the February numbers tell us is where the market was heading into spring, and the trajectory — tightening supply, accelerating contract timelines, pricing at or above expectations — was pointing clearly in one direction.
More Qualified Buyers Than Last Year
Here's a fact that has received considerably less attention than the scary headline: over the past year, housing affordability improved in all 50 states. That finding comes from First American, one of the most trusted sources of housing finance data in the country. While housing affordability is still below the historical norms that prevailed before the 2020–2022 price run-up, the pressure that kept buyers on the sidelines has measurably eased across every state in the country — including Nevada.
Chen Zhao, Head of Economic Research at Redfin, framed the shift this way: "The housing affordability crisis is showing signs of easing — opening the door for more Americans to make the jump to homeownership." That observation applies nationally, which means it includes the households who have been watching the Reno-Sparks market from a distance and waiting for conditions to shift enough to make purchase viable.
Affordability improvement is a seller-favorable signal, not a buyer-favorable one. When more households can qualify for a mortgage at Reno pricing, the pool of potential buyers for your home expands. Some of those buyers have been sitting on the sidelines for two or three years — not because they stopped wanting to own a home in Damonte Ranch or Caughlin Ranch, but because the math didn't work. When the math starts working again, they come back. First American's finding suggests that process has already begun across all fifty states.
Running this in dollar terms at current Reno-Sparks pricing: a buyer financing $550,000 at today's Freddie Mac rate of 6.22% carries a monthly principal-and-interest payment of approximately $3,370. At the 6.67% average from this same week a year ago, that same buyer was looking at roughly $3,540 per month — a difference of $170 per month, or about $61,000 over the life of the loan. That improvement in purchasing power is real, and it's flowing into a market with limited supply.
This matters alongside the buyer profile that has characterized meaningful demand in Reno-Sparks for several years. A significant portion of well-qualified buyers arriving in this market come from California, Washington, and Oregon — often with substantial equity from prior home sales. These buyers are frequently putting down 30 to 50 percent, borrowing less against the purchase price, and financing at levels where a quarter-point rate movement doesn't fundamentally change their transaction. Their purchasing power is structurally different from the first-time buyer relying on maximum loan-to-value financing. A detailed look at who's actually buying Reno-Sparks homes in 2026 walks through the equity math on what California sellers bring to the table when they arrive here as buyers. The expanded buyer pool from affordability improvement expands the total universe of potential purchasers. The California equity cohort provides a durable floor underneath it.
The Window That's Already Opening — and Has a Defined Close
National timing research offers useful context even when local market conditions differ from the national average. This week, both Realtor.com and Zillow published their analyses of the best listing windows for spring 2026, and the findings are specific enough to matter.
Realtor.com identifies the week of April 12–18 as the peak national listing window. Homes that go to market during that window historically sell for approximately 1.3% more than the annual average — in today's market, that translates to roughly $5,300 above the annual median national home price, and as much as $26,000 more than homes were selling for at the start of the year. More telling for sellers who care about the transaction experience: homes listed during that week generated 16.7% more buyer views than a typical week, and 18.9% of them avoided price reductions entirely. In 2025, homes that listed during that window averaged about 50 days on market compared to a 60-day annual average.
Zillow's analysis, using a different methodology, identified the last two weeks of May as the premium window, with sellers netting approximately $6,000 more based on national averages — and significantly higher premiums in select markets. Both analyses land on the same directional conclusion: spring's highest-leverage listing window is already approaching, and sellers who want to capture it need to be positioned before it opens — not scrambling to prepare during it.
Hannah Jones, senior economic research analyst at Realtor.com, made an observation worth sitting with: "Sellers in the South and West where inventory is more abundant face softer conditions. In those metros, optimizing timing to this early spring window is even more critical to differentiate a property from the growing competition." That sentence is written specifically about inventory-abundant Sun Belt markets — but the corollary is instructive. In markets where inventory is not abundant, like Reno-Sparks, sellers have the strategic advantage of positioning ahead of the seasonal competition wave rather than racing against it.
Here's the timing mechanic. By late June, new listings nationally surge more than 38%, per Realtor.com data. That seasonal flood of competition arrives every year with predictable consistency. Some of those late-spring listings will be priced correctly and presented beautifully. Others will be rush-listed without the preparation that separates first-offer outcomes from 60-day price reductions. The sellers who benefit most from the spring window are those who completed their preparation before the competitive wave, not during it.
At Reno's 34-day median days-to-contract and Sparks' 17-day median in February, homes that are ready when April arrives don't miss the window — they define it. If you want to be on market by April 12, the preparation clock is already running. Our spring selling analysis covers the mechanics of that timing in detail.
The Rate Picture: Honest, Not Alarming
Mortgage rates are not where sellers — or buyers — would prefer them. The Freddie Mac Primary Mortgage Market Survey recorded the 30-year fixed rate at 6.22% as of March 19, up from 6.11% the prior week. Jill Lyons, Branch Manager at CMG Home Loans on Longley Lane in Reno, noted in her weekly market movement summary this week that rates have trended higher through March, with elevated volatility expected to continue in the near term. The Federal Reserve held the federal funds rate unchanged at 3.75% at last week's FOMC meeting — in line with expectations. But the Fed's decision doesn't directly set mortgage rates. Those move with the 10-year Treasury yield, which has been responding to geopolitical signals including the ongoing situation in Iran and its effect on oil prices and inflation expectations.
Daily rate readings from Mortgage News Daily climbed above 6.5% last week before dipping back slightly — an indication of how quickly conditions can shift in either direction right now. The volatility signal is genuine and worth factoring into timing decisions.
That said, the year-over-year comparison is the most useful frame for sellers thinking about their buyer pool. The 30-year fixed rate averaged 6.67% during this same week in March of 2025. At 6.22% today, buyers have meaningfully more purchasing power than the buyers who were in this market a year ago. The national pending home sales index rose 1.8% month-over-month in February, suggesting that buyers are actively engaging despite the rate environment rather than retreating from it. Purchase mortgage applications for the week ending March 13 increased 1% even as the Refinance Index dropped sharply — an indicator that buyer demand specifically, separate from refinancing behavior, remains engaged.
The question for sellers isn't whether current rates are ideal. They're not. The question is whether the buyers available to you today are more or less capable than the buyers who were available a year ago. The answer, by the data, is more capable — and First American's affordability improvement finding suggests that pool is still expanding.
The New Home Competition Factor
One more data point worth understanding: nationally, new home sales fell sharply in January 2026 — down 17.6% in a single month, from 712,000 to 587,000 annualized, well below market expectations. That's not a rounding error. New construction has been a meaningful competitor to the existing home resale market in recent years; when builders discount inventory and offer mortgage rate buydown programs, some buyers who might otherwise purchase existing homes redirect their search toward new construction.
When new home sales decline this dramatically, those buyers don't disappear — they migrate toward the resale market. Existing homes become the primary option for buyers who couldn't find new construction at the right price point, timeline, or location. The EDAWN 2026 State of the Economy presentation data captures part of the structural reason for this locally: Brian Gordon of Applied Analysis noted that builders are rapidly redirecting construction activity toward data centers rather than residential projects. "Builders losing appetite to build anything but data centers" was his observation. The practical consequence for existing home sellers is reduced new construction competition at exactly the moment when buyer demand remains active.
The pricing picture confirms the dynamic. The trailing twelve-month median for existing home sales in the Reno-Sparks market sits at $555,542. The comparable figure for new homes is $592,953 — a spread of nearly $37,400 in favor of existing homes for buyers doing their purchase math. When new construction is less available and priced at a premium, well-prepared existing homes in Southwest Reno, ArrowCreek, Wingfield Springs, and Double Diamond are the compelling option.
The Structural Demand That Doesn't Wait for April
The supply picture and the timing analysis are genuinely useful tools for sellers making decisions this spring. But the deeper story for Reno-Sparks sellers is the structural demand argument — the reason why this market consistently behaves differently from other Western metros that have experienced similar migration inflows.
At EDAWN's 2026 State of the Economy presentation, attended by Kevin Kinney on February 5, the Reno Metropolitan Statistical Area was ranked the number one leading metro for economic growth out of 949 national metros. The presentation documented $534 million in new business investment in 2025, 593 new jobs at an average salary of $76,800, the arrival of the region's first tech unicorn, and $1 billion in venture capital flowing into the Northern Nevada startup ecosystem. The region's data center growth rate has reached up to 953%, the fastest in the United States, outpacing Salt Lake City, Phoenix, Atlanta, Dallas-Fort Worth, Chicago, Austin, and Denver simultaneously, according to the Upwind/JLL 2024 Data Center Report.
That economic profile creates demand that operates outside the spring selling calendar. A data center engineer accepting a position and relocating to Reno has a timeline driven by their employment start date, not by when HGTV says to list. Corporate relocations from California follow their employers' expansion schedules. Technology sector hires landing in the metro area have 90-day housing search windows determined by lease expirations and onboarding timelines, not by what Zillow publishes about May premium pricing. Understanding who these buyers are and what their financial profile looks like changes how sellers think about the nature of the demand they're listing into.
Nevada's inbound migration ranking — number ten nationally, per the United Van Lines 2025 National Movers Study — reflects the sustained draw of the region's tax environment, job market, and quality of life for the households leaving California, Washington, and Oregon. That migration doesn't pause in October when the national market softens. It doesn't freeze when a national headline announces that sellers outnumber buyers. It follows employment, equity events, and life circumstances on its own timeline.
The Sun Belt markets that are experiencing genuine buyers market conditions are dealing with a different problem: demand that arrived rapidly during the pandemic years and has partially reversed as remote work arrangements normalized and migration patterns recalibrated. Reno-Sparks is not experiencing reversal. It's experiencing a structural demand curve backed by one of the strongest economic growth profiles of any metropolitan area in the country.
What Prepared Sellers Are Doing This Week
The sellers who will make the most of the April window are the ones who started their preparation in March. If you've been telling yourself you'll think seriously about listing once spring is fully underway, the data suggests that timeline is already compressing.
When Kevin and Robin walk through a home with a seller at the beginning of a listing engagement, the first order of business is understanding exactly what the home is worth in the current market — not last year's market, not the neighborhood's best sale from eighteen months ago, but the specific, current comparable sales data that determines where your home positions against everything else a buyer will see. Robin has been doing comparative market analyses in this market for over two decades, and that analysis is the foundation the entire pricing strategy rests on. Getting it done now, before committing to any specific timeline, means you'll know what to expect before you've obligated yourself to anything.
Kevin manages the vendor relationships that make rapid, effective preparation possible — painters, cleaners, landscapers, and tradespeople who understand the standard that today's well-qualified buyers bring to their home search. Coordinating that work ahead of listing, rather than during it, is the operational difference between a controlled, confident market launch and a scramble that costs you both time and negotiating position.
The full pre-listing preparation process covers what the best-prepared Reno-Sparks sellers do before they list — the inspection considerations, the preparation priorities that actually move the needle, and the Chase International Chase Ready program, which provides a full pre-listing inspection, home warranty, completed disclosures, and preliminary title search before the home goes to market. No other brokerage in Reno-Sparks offers that program.
The conversation that matters most for sellers who are genuinely considering a spring listing is a specific one: what does your home look like in the current market, what preparation is worth doing, and is April 12–18 a realistic target for your situation. That conversation is an hour. Postponing it by four weeks doesn't make it easier — it just shrinks your options.
The national headline from this morning describes a real shift in the national housing market. The buyers market it documents is real in substantial parts of the country — particularly in the Sun Belt markets that experienced the most aggressive post-pandemic construction cycles. Reno-Sparks is not one of those markets. The sellers who understand the geographic texture of the national story are positioned differently than those who read the headline and freeze.
The spring window opens in three weeks. The sellers who move now won't be chasing it.
If you're considering listing your Reno-Sparks home this spring and want a thoughtful conversation about your timing and goals, we're glad to have it. Contact Kevin Kinney at 775-391-8402 or Robin Renwick at 775-813-1255.
Frequently Asked Questions
Is it a good time to sell a home in Reno or Sparks right now? The local data says yes — with preparation. Sparks had 1.6 months of supply in February and a median 17 days to contract. Reno had 2.1 months of supply with sellers receiving 98.6% of list price. Both cities are well below the 4- to 6-month supply range that defines a balanced market. The caution isn't about market conditions — it's about preparation. Homes that arrive on the market well-priced and well-presented are performing. Homes that arrive rushed or overpriced are not.
What does "46% more sellers than buyers nationally" actually mean for Reno-Sparks homeowners? It means the national housing market has shifted in favor of buyers — particularly in Texas and Florida, which are the core of that story. For Reno-Sparks specifically, the local inventory and list-price-received data tells a different story. National statistics are weighted averages across hundreds of metro markets; the geographic shape of who's driving those numbers matters more than the headline figure. Reno-Sparks supply is less than half of what would constitute a balanced market.
When is the best time to list a home in Reno-Sparks in spring 2026? Nationally, Realtor.com identifies the week of April 12–18 as the peak listing window — homes listed that week historically sell for roughly 1.3% more, receive 16.7% more views, and see 18.9% fewer price reductions. Zillow's analysis identifies late May. In Reno-Sparks, the meaningful question is whether you can be fully prepared by the time that window opens, not whether you should wait for it. At Sparks' 17-day median contract timeline, a well-prepared listing that arrives in early April doesn't miss the window — it leads it.
How do Reno-Sparks housing supply figures compare to national averages? The national housing supply has been climbing toward the 4- to 6-month balanced market threshold in recent months, driven largely by Sun Belt inventory growth. Reno sat at 2.1 months in February, Sparks at 1.6 months — both well below that range. National supply is also still approximately 16.8% below pre-pandemic norms, per Realtor.com. Reno-Sparks supply is even tighter than the national picture.
What is the Sun Belt Trap and why does it matter for sellers in Reno or Sparks? The Sun Belt Trap is the cognitive error of applying national real estate headlines — which are often dominated by inventory conditions in Texas, Florida, and the broader South — to your specific home in a structurally different market. When a seller in Northwest Reno reads that sellers outnumber buyers by the largest margin in a decade and assumes their market is shifting, they may be making a decision based on data that describes Jacksonville or Austin rather than their neighborhood. Checking local inventory, supply, and list-price-received numbers before adjusting your strategy is the antidote.
How has housing affordability changed for buyers in Nevada? First American's research, published in March 2026, found that housing affordability improved in all 50 states over the prior year — including Nevada. The improvement reflects a combination of wage growth, modest price moderation, and lower mortgage rates compared to early 2025 peak levels. At the Freddie Mac rate of 6.22% as of March 19, buyers in Reno-Sparks have meaningfully more purchasing power than buyers who were in this market a year ago when the same rate averaged 6.67%.
How do new home sales figures affect Reno-Sparks existing home sellers? National new home sales fell 17.6% month-over-month in January 2026, from 712,000 to 587,000 — a significant decline. When new construction becomes less available, buyers who might have considered new homes turn to the resale market. Locally, EDAWN data confirms builders are redirecting activity toward data center construction rather than residential projects, constraining new supply further. Existing home sellers in Reno-Sparks benefit from reduced new construction competition.
What should I do first if I'm considering listing this spring? Start with a current comparative market analysis while there's still time to act on it. Understanding what your home is worth in this specific market, what preparation will move that number, and whether a pre-April timeline is realistic gives you the information to make a confident decision. Kevin and Robin walk through every home they represent together before listing — that initial conversation, with Robin's CMA analysis at the center of it, is the foundation the entire strategy rests on. There's no obligation attached to it, and it takes about an hour.
Check out this article next