


Data in this post is sourced from the Northern Nevada Regional MLS (NNRMLS) via Domus Analytics, updated April 5, 2026, reflecting March 2026 single-family residential transactions in Reno and Sparks, Nevada. Mortgage rate data is from Freddie Mac's Primary Mortgage Market Survey (PMMS), released April 2, 2026. Economic data sourced from EDAWN's 2026 State of the Economy presentation (February 5, 2026) and Upwind/JLL 2024 Data Center Report. All figures are believed accurate but are not guaranteed. This post is for informational purposes only and does not constitute financial, legal, or investment advice. Past market performance does not guarantee future results.
Key Takeaways
- Reno's median sales price reached $632,000 in March 2026 — up 4.5% year-over-year and holding near the highest levels this market has recorded
- Closed sales surged 23.2% from February in Reno and 43.0% in Sparks — spring demand didn't build gradually; it arrived all at once
- Reno's median days to contract compressed from 34 days in February to 15 days in March — buyers went from methodical to committed in a single month
- Sparks active inventory is down 31.4% year-over-year with just 1.1 months of supply — the tightest reading of this cycle
- Sellers in both cities received within 1% of asking price: 98.9% in Reno, 99.3% in Sparks
For weeks, the conversation around the Reno-Sparks spring market had the quality of something anticipated rather than observed. Inventory was tight, structural demand was intact, the economic engine underneath this metro was still running. The data from January and February validated those fundamentals, but both months carried the particular limitations of winter — seasonally suppressed volume, buyers still calculating, sellers still deciding. March arrived and all of that changed.
The Northern Nevada Regional MLS data for March 2026, released through Domus Analytics this week, describes a market that didn't gradually warm into spring. It accelerated into it. Closed sales in Reno jumped 23.2% from February. In Sparks, they surged 43.0%. The median days to contract in Reno fell from 34 days — already a strong figure — to 15. New listings flooded in at a pace that, in a softening market, would typically send inventory climbing and prices retreating. Instead, Reno's active inventory ended March exactly where it began. The market absorbed every new listing almost as fast as sellers could prepare them. That's not a seasonal bounce. That's structural demand arriving in full force.
If you own a home in Reno or Sparks and have been watching the market from the sidelines, waiting to find the right moment to act, March gave you the data you were waiting for. The question isn't whether the spring market materialized. It did. The question is what you do with that information now.
What the March 2026 Numbers Show — Reno
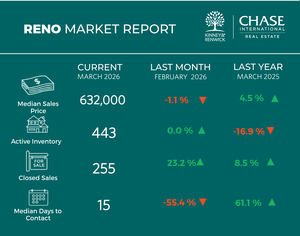
Reno's median sales price for single-family homes came in at $632,000 in March — 4.5% above March 2025 and a modest 1.1% seasonal softening from February's $639,000. Month-over-month price fluctuations of this magnitude are normal and expected as spring volume ramps and different price segments contribute to the monthly calculation. The year-over-year number is the more reliable signal, and it's pointing in one direction.
The headline for Reno in March isn't price — it's pace. Two hundred and fifty-five homes closed during the month, up 8.5% from March 2025 and 23.2% from February. That acceleration reflects what happens when buyers who have been pre-approved and actively searching finally find homes that match their criteria. It shows up most vividly in two places: closing volume and days to contract.
Fifteen days. That's the median time from listing to accepted contract for Reno single-family homes in March 2026. In February, that figure was 34 days. The 55.4% compression in a single month reflects a buyer pool that went from methodical to motivated virtually overnight. For sellers, what that means practically is that a well-priced, well-presented home entering the market now — carrying March's momentum into April — is facing buyers who are moving with genuine urgency.
The per-square-foot picture adds useful texture. Reno's median sold price per square foot came in at $333 in March, up 1.2% from February. Year-over-year, that figure is down 2.9% from spring 2025's elevated readings — a reminder of how exceptionally fast last year's spring was, rather than a signal of current weakness. Month-over-month, per-square-foot values are trending in the right direction.
What makes the inventory story particularly compelling is what didn't happen. Three hundred and sixty-six new listings entered the Reno market in March — a 59.8% increase from February's total. In a market with softening demand, that supply surge would translate directly into higher inventory numbers and the beginning of price pressure on sellers. Instead, Reno's active inventory ended March at 443 homes: unchanged from where it started the month. The 1.7 months of supply reading is down 23.4% year-over-year and 18.8% from February. Every wave of new listings was met by a corresponding wave of buyers. The market absorbed the surge in real time.
Sellers in Reno received 98.9% of their list price in March — essentially unchanged from February and marginally better than a year ago. At the $632,000 median, the typical gap between list price and sale price represents roughly $7,000. In a genuine seller's market, near-full-price offers are the standard, not the exception. March confirms that standard is holding.
What the March 2026 Numbers Show — Sparks
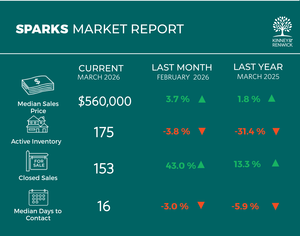
The Sparks data is, if anything, sharper. The median sales price for single-family homes reached $560,000 in March — 3.7% above February and 1.8% higher than March 2025. In a city where inventory has been falling consistently, prices have done exactly what supply constraints typically produce: held firm while the rest of the market around them fluctuates.
One hundred and fifty-three homes closed in Sparks in March 2026, a 43.0% jump from February and 13.3% more than the same month a year ago. That closing volume, in a city with 175 active listings, means homes are turning over at a pace that keeps supply perpetually thin. The median days to contract held at 16 — flat with February and a slight improvement from last March. Sparks has been running at a consistently fast pace through the winter months, and March confirmed that rhythm.
The figure that commands the most attention in the Sparks data is 1.1 months of supply. That's a 39.4% decline from March 2025 and a 32.8% decline from February — one of the tightest supply readings this market has posted in this cycle. A balanced market, where buyers and sellers hold roughly equal leverage, typically requires five to six months of supply. Sparks is operating at less than one-quarter of that threshold.
For neighborhoods like Spanish Springs, Wingfield Springs, and the newer communities along the eastern edge of the city, 99.3% list price received tells the practical story. Buyers competing for Sparks listings are not negotiating from a position of strength. In many cases, they're competing against other qualified buyers for a home that was listed days ago.
The Absorption Story: Why This Month Is Different
There's a version of the March data that a casual reader might misread. New listings surged — 59.8% in Reno and 44.0% in Sparks compared to February. In most markets, that kind of supply influx is the first signal of a softening cycle: sellers sensing a peak, rushing to exit before conditions change, more options arriving for buyers who have been waiting for leverage.
That interpretation requires a different inventory outcome than the one the data produced. Despite the surge in new listings, Reno ended March with 443 active homes — flat with the prior month. Sparks dropped from 182 to 175. The market wasn't flooded with choices. It was flooded with supply, and demand absorbed that supply almost in real time.
This is what I'd call The Absorption Gap — the distance between the volume of new listings entering a market and that supply actually accumulating as available inventory. When The Absorption Gap is narrow, when new supply gets consumed as fast as it arrives, sellers have the market to themselves. New competition enters; it doesn't accumulate. When that gap widens, buyers gain options and the negotiating environment begins to shift.
In Reno-Sparks in March 2026, The Absorption Gap was effectively zero. For sellers in Somersett, Double Diamond, South Meadows, and the established neighborhoods of Caughlin Ranch and Southwest Reno, that means the arrival of spring listings isn't eroding their position. The buyers are there, and they're absorbing new supply as fast as it appears. A well-prepared home entering this market isn't arriving into a sea of competition. It's arriving into a market that has been waiting for it.
The Rate Environment: What 6.46% Actually Means for Your Transaction
Mortgage rates have moved in the wrong direction since the early-spring lows. After reaching 6.00% in early March, the Freddie Mac Primary Mortgage Market Survey showed the 30-year fixed-rate mortgage at 6.38% on March 26 and 6.46% as of April 2, 2026. Sam Khater, Freddie Mac's Chief Economist, noted that with spring homebuying season in full swing, buyers who shop across multiple lenders can potentially save thousands of dollars — a statement that reinforces that rates are being felt in purchasing decisions, even among motivated buyers.
What does 6.46% mean for a transaction at Reno's March median price? A buyer purchasing at $632,000 with a standard 20% down payment is financing approximately $506,000. At 6.46%, the monthly principal and interest payment comes to roughly $3,182. At the 6.00% rate buyers saw in early March, that same loan cost approximately $3,031 per month. The difference is $151 monthly — about $54,000 over the life of a 30-year loan. For buyers near the edge of their qualification range, that movement is meaningful. For the California equity relocator purchasing in Damonte Ranch or Northwest Reno with a large down payment, it's real but not transaction-altering.
The year-over-year comparison is worth noting. A year ago at this point, the 30-year fixed-rate averaged 6.64%. Today's 6.46% is 18 basis points better. On a $506,000 loan, that translates to approximately $62 per month in savings versus spring 2025. Buyers who delayed a year hoping for dramatically lower rates are operating in essentially the same environment — but competing for a Reno-Sparks market that has 16.9% less inventory than it did a year ago and prices that have moved 4.5% higher.
The dynamic for sellers is subtle but worth understanding. The buyers active in a 6.46% rate market are self-selected. The buyers who needed rates to be at 6.00% to feel comfortable transacting have stepped back. The buyers still making offers are the ones who have processed the rate environment and decided the math still works for their situation — because they're moving from California, because their equity position is strong, because their job transfer is real, or because they've simply been looking long enough that waiting has its own cost. In Sparks, with 175 homes on the market for a city of 110,000 people, that self-selected buyer pool produces genuine competition for well-positioned listings.
The Economic Foundation Underneath the Numbers
National real estate commentary in April 2026 is centered on familiar themes: tariff uncertainty, Treasury yield pressure, rate volatility, and the same geopolitical turbulence that has been affecting markets since late February. Those headlines have reach. They land in the inboxes of Reno-Sparks homeowners who are trying to make clear-eyed decisions about spring.
The distinction worth drawing is between markets where caution is economically rational and markets where it isn't. As we've examined in the context of the Sun Belt inventory dynamics driving the national sellers-outnumber-buyers narrative, Reno-Sparks operates on a fundamentally different structural reality than the markets generating the national headlines. If you've followed the national story closely this spring and found yourself wondering whether it applies here, the March inventory data provides the clearest possible answer: it doesn't.
The EDAWN 2026 State of the Economy report, presented in February at a session Kevin Kinney attended in person, documented the economic engine that keeps demand structural rather than seasonal in this market. The Reno Metropolitan Statistical Area ranked number one for economic growth out of 949 national metros. The region attracted $534 million in new business investment in 2025, added 593 new jobs at an average salary of $76,800, and logged its first tech unicorn. Data center construction — a sector reshaping Reno's economic identity in ways few metros can match — is projected to see spending rise 23% in 2026, per the Upwind/JLL 2024 Data Center Report. Builders who might otherwise be adding residential supply are redirecting capacity toward digital infrastructure, keeping a construction ceiling on a housing market where demand keeps arriving.
Nevada's inbound migration ranking — tenth nationally per United Van Lines 2025 data — contributes buyer demand that has nothing to do with rate movements. The households relocating to Reno-Sparks from California, Washington, and Oregon are making life decisions: zero state income tax, lower property taxes, proximity to Tahoe, employment growth, and a quality-of-life trajectory that Bay Area and Pacific Northwest metros can no longer replicate in the same way. We've examined the specific financial math behind those decisions — what California equity translates to as Reno-Sparks purchasing power — in our analysis of who's actually buying homes here in 2026. That buyer arrives prepared. They know the numbers. The right listing meets them ready.
For sellers in ArrowCreek, Galena Forest, Somersett, and Old Southwest Reno — neighborhoods that consistently draw the highest-equity California buyers — this demand profile means the buyer pool for a quality spring listing is deep, financially capable, and motivated by factors that a 46-basis-point rate move doesn't alter.
What Sellers Who Are Still Watching Need to Understand
There's a particular kind of hesitation that shows up in seller conversations in April. It's different from the fear that dominated January or the uncertainty that persisted through parts of February and March. By now, most sellers who have been paying attention have processed the national headline noise. They understand the local market isn't the Sun Belt story. They've seen friends sell well this spring. What keeps them from moving isn't fear — it's a quiet assumption that the market will be approximately this good in May or June, and that a few more weeks won't cost anything meaningful.
That assumption is worth examining carefully.
The supply trajectory tells part of the story. March's 59.8% surge in new Reno listings didn't overwhelm the market — but that absorption capacity isn't unlimited. As more sellers, looking at the same March data, decide to act in April and May, the number of competing listings will grow. The market absorbed March's wave. It will absorb April's wave. At some point, the accumulation of spring supply begins to give buyers genuine choices between competing homes, and the compressed days-to-contract pace begins to normalize. Sellers who list while supply is still constrained capture the market at its tightest. Sellers who list when supply has normalized are competing in a different environment.
Rates add another layer. The 30-year fixed has moved from 6.00% in early March to 6.46% as of April 2. If that trend continues — driven by the same Treasury yield dynamics that have been in play since late winter — buyer purchasing power will continue to compress in small increments. The buyers in the market today are qualified at today's rates. Each upward tick doesn't improve anyone's position.
The third factor is the corporate relocation calendar. Spring in Reno-Sparks peaks in April and May for a specific reason: California families targeting school-year transitions in July and August need to close by June. Those buyers are touring actively right now. They need to be in contract within weeks, not months. Sellers who are on the market in April and early May are positioned to capture that buyer cohort. Sellers who are still preparing when those buyers are writing offers on alternatives miss the most time-constrained segment of spring demand.
For sellers whose hesitation involves capital gains — a pattern we've seen consistently among long-term owners in Somersett, Double Diamond, and South Meadows — the math of delay often makes the concern more expensive rather than less. Most sellers who have owned for more than a decade and made improvements over time have substantially more cushion under the federal exclusion than they realize. Our recent post on capital gains considerations for high-equity Reno-Sparks sellers walks through that calculation in detail, including what Nevada's zero-state-capital-gains advantage means for households comparing their Nevada tax exposure to what they would have faced in California, Oregon, or Washington.
What Well-Prepared Sellers Are Doing Right Now
The sellers capturing the best outcomes from the March market momentum aren't the ones who saw the data and called an agent the same afternoon. They're the ones who started the conversation in February or early March, completed their preparation work deliberately, and entered the market with a strategy — not a reaction.
In practice, that means a pricing conversation and comparative market analysis before photography, because pricing shapes how a home is positioned from day one. It means professional photography scheduled with lead time — Northern Nevada photographers are booking a week to ten days out in spring. It means any repairs, touch-ups, and staging decisions completed before cameras arrive, not after the listing goes live. It means a marketing approach that accounts for who the most qualified buyers are for a specific neighborhood: a home in Wingfield Springs is speaking to a different buyer profile than a home in South Reno or Sparks, and the listing strategy should reflect that understanding.
The sellers who get this right don't just sell faster. They sell in a way that produces fewer surprises at inspection, cleaner contract-to-close execution, and a final number that reflects what the market was genuinely willing to pay rather than what was accepted under time pressure. The pre-listing preparation guide we published for Reno-Sparks sellers covers the specific steps that matter most — and the sequence that prevents costly mistakes. What separates a 15-day outcome from a 45-day outcome in this market isn't luck. It's the work done before the listing goes live.
Reading March Honestly: Strength With Texture
Most market updates present data in the most favorable light available. That's not the goal here.
The March 2026 data for Reno-Sparks is genuinely strong for sellers, but it has nuance worth understanding. Reno's median days to contract — 15 days in March 2026 — is roughly 61% slower than March 2025's pace of approximately 9 days. Last spring was exceptional, operating at a pace that reflected near-peak conditions. March 2026 is very healthy, but it's not identical to the spring that preceded it. Sellers entering this market will find buyers who are moving quickly — but buyers who are also more deliberate than their 2025 counterparts.
Reno's per-square-foot values at $333 are running 2.9% below March 2025. That year-over-year softening, alongside the compression in days to contract relative to last year, tells a consistent story: the market rewards preparation and pricing precision. Homes that arrive well-presented and correctly positioned relative to comparable active inventory in Somersett, Caughlin Ranch, or Double Diamond will perform at the level the headline metrics suggest. Homes that arrive overpriced or underprepared will not.
Sparks tells a more uniformly positive story. Inventory continues to compress year-over-year, list price received is essentially at par, and closed volume is growing at a healthy rate. The 1.1 months of supply figure in Sparks is among the tightest readings this market has posted in the current cycle. For sellers in any Sparks neighborhood, the March data describes conditions that remain as favorable as they've been at any recent point.
Taken together, March 2026 is the confirmation sellers needed. The spring market arrived — and it arrived with force. It isn't without nuance, and pricing precision matters more than it did at last year's peak. But for sellers who approach the market with a clear strategy, realistic expectations, and proper preparation, the conditions for a strong spring outcome are as favorable as this market has offered in years.
If you're considering a strategic sale or a well-prepared purchase, we're happy to have a thoughtful conversation about your goals. Contact Kevin Kinney at 775-391-8402 or Robin Renwick at 775-813-1255.
Frequently Asked Questions
What is the median home price in Reno in March 2026? The median sales price for single-family homes in Reno was $632,000 in March 2026, according to data from the Northern Nevada Regional MLS via Domus Analytics. That represents 4.5% appreciation year-over-year and a 1.1% seasonal adjustment from February's $639,000 reading. Year-over-year price growth of 4.5% in a supply-constrained market is a solid seller-favorable signal.
How long does it take to sell a home in Reno-Sparks right now? As of March 2026, the median days to contract for single-family homes was 15 days in Reno and 16 days in Sparks. In Reno, that represents a 55.4% compression from February's 34-day median — a dramatic acceleration as spring buyer activity arrived. In Sparks, pace has been consistently fast through the winter and spring, holding near 16-17 days for several months. Well-priced, well-presented homes in both cities are routinely going under contract within two to three weeks of listing.
Is it a buyer's or seller's market in Reno-Sparks in spring 2026? Both Reno and Sparks remain clearly in seller's market territory. Reno's months of supply sits at 1.7 — down 23.4% year-over-year — and Sparks is at 1.1 months, one of the tightest readings in this cycle. A balanced market, where neither buyers nor sellers hold structural advantage, requires five to six months of supply. Both markets are well below half that threshold. Sellers in both cities received within 1% of asking price in March, confirming that buyer competition for well-priced listings remains genuine.
What is the housing inventory situation in Sparks right now? Sparks active single-family inventory stood at 175 homes at the end of March 2026 — down 31.4% from a year ago and 3.8% from February. With 153 homes closing in March and 167 new listings entering the market, the turnover pace is high enough that new supply is being absorbed almost as fast as it arrives. At 1.1 months of supply, Sparks is operating in one of the most supply-constrained conditions this cycle has produced.
How are rising mortgage rates affecting Reno-Sparks home sellers? The 30-year fixed-rate mortgage averaged 6.46% as of April 2, 2026 (Freddie Mac PMMS), up from 6.00% in early March. For a buyer at Reno's $632,000 median price with 20% down, the rate movement from 6.00% to 6.46% represents approximately $151 per month in additional carrying cost. That affects buyers at the qualification margin more than it affects the well-capitalized California equity relocators who represent a significant portion of the buyer pool for quality Reno-Sparks homes. Rates today are 18 basis points below where they were a year ago — meaning buyers are in a modestly better position than in spring 2025, even if they're off the spring lows.
Is spring 2026 a good time to sell a home in Reno or Sparks? The March 2026 data makes a strong case for yes — with the appropriate context that outcomes depend heavily on pricing and preparation. Months of supply is at 1.1-1.7 months. Sellers are receiving 98.9-99.3% of list price. Days to contract are 15-16 days. Closed sales accelerated 23-43% from February. The economic fundamentals driving buyer demand — Reno's number-one national growth ranking, Nevada's tax advantages, sustained in-migration from California and the Pacific Northwest — are structural rather than seasonal. Sellers who price correctly and present well are operating in one of the most favorable environments this metro has offered in recent years.
What's driving home prices in Reno-Sparks in 2026? Supply constraint is the primary driver. Combined active inventory across Reno and Sparks sits at 618 homes for a metro of more than 400,000 people — down significantly from already-low 2025 levels. On the demand side, the EDAWN 2026 State of the Economy report ranked the Reno Metro Statistical Area first for economic growth out of 949 national metros, with $534 million in new business investment, 593 new jobs averaging $76,800, and data center construction growing at up to 953% — the fastest rate in the United States. Migration inflows from California, Oregon, and Washington contribute a buyer cohort with substantial equity and purchasing power that is structurally independent of local wage dynamics.
How does the Reno-Sparks housing market compare to national trends in spring 2026? The national narrative in spring 2026 is centered on Sun Belt markets — particularly Texas and Florida — where pandemic-era construction outpaced sustainable demand and inventory has accumulated. Those conditions have produced buyer-favorable markets in specific geographies that are now driving national seller-outnumber-buyer statistics. Reno-Sparks is structurally different. Builders in Northern Nevada have redirected capacity toward data center construction, limiting residential supply. In-migration demand is driven by Nevada's structural tax advantages and a regional economy ranked first nationally — factors that don't respond to the same pressures affecting Florida and Texas markets. The result is a market that consistently performs differently from national averages, and the March 2026 data confirms that divergence is intact.
Check out this article next